Are rising costs eating your margins? Discover the 5 financial metrics every New York City restaurant owner must track—from Prime Cost to Menu Engineering—to boost profitability today.
Running a restaurant in New York City often feels like a battle between high sales volume and disappearing cash. You see a full dining room on a Friday night, but when the bank statement arrives, the numbers don’t add up.
The hard truth? High revenue does not equal high profit.
In an industry where the average profit margin for full-service restaurants sits precariously between 3% and 5%, there is zero room for error. With rising labor costs in New York and fluctuating ingredient prices, operating on “gut feeling” isn’t just risky—it’s dangerous.
To move from survival mode to growth mode, you must master the financial metrics that matter. Here are the 5 operational “leaks” likely draining your bank account, and how to plug them.
1. The “Prime Cost” Trap
If you only look at one number this week, make it this one. Prime Cost is the sum of your Cost of Goods Sold (COGS) and your Total Labor Costs. It represents the bulk of your controllable expenses.
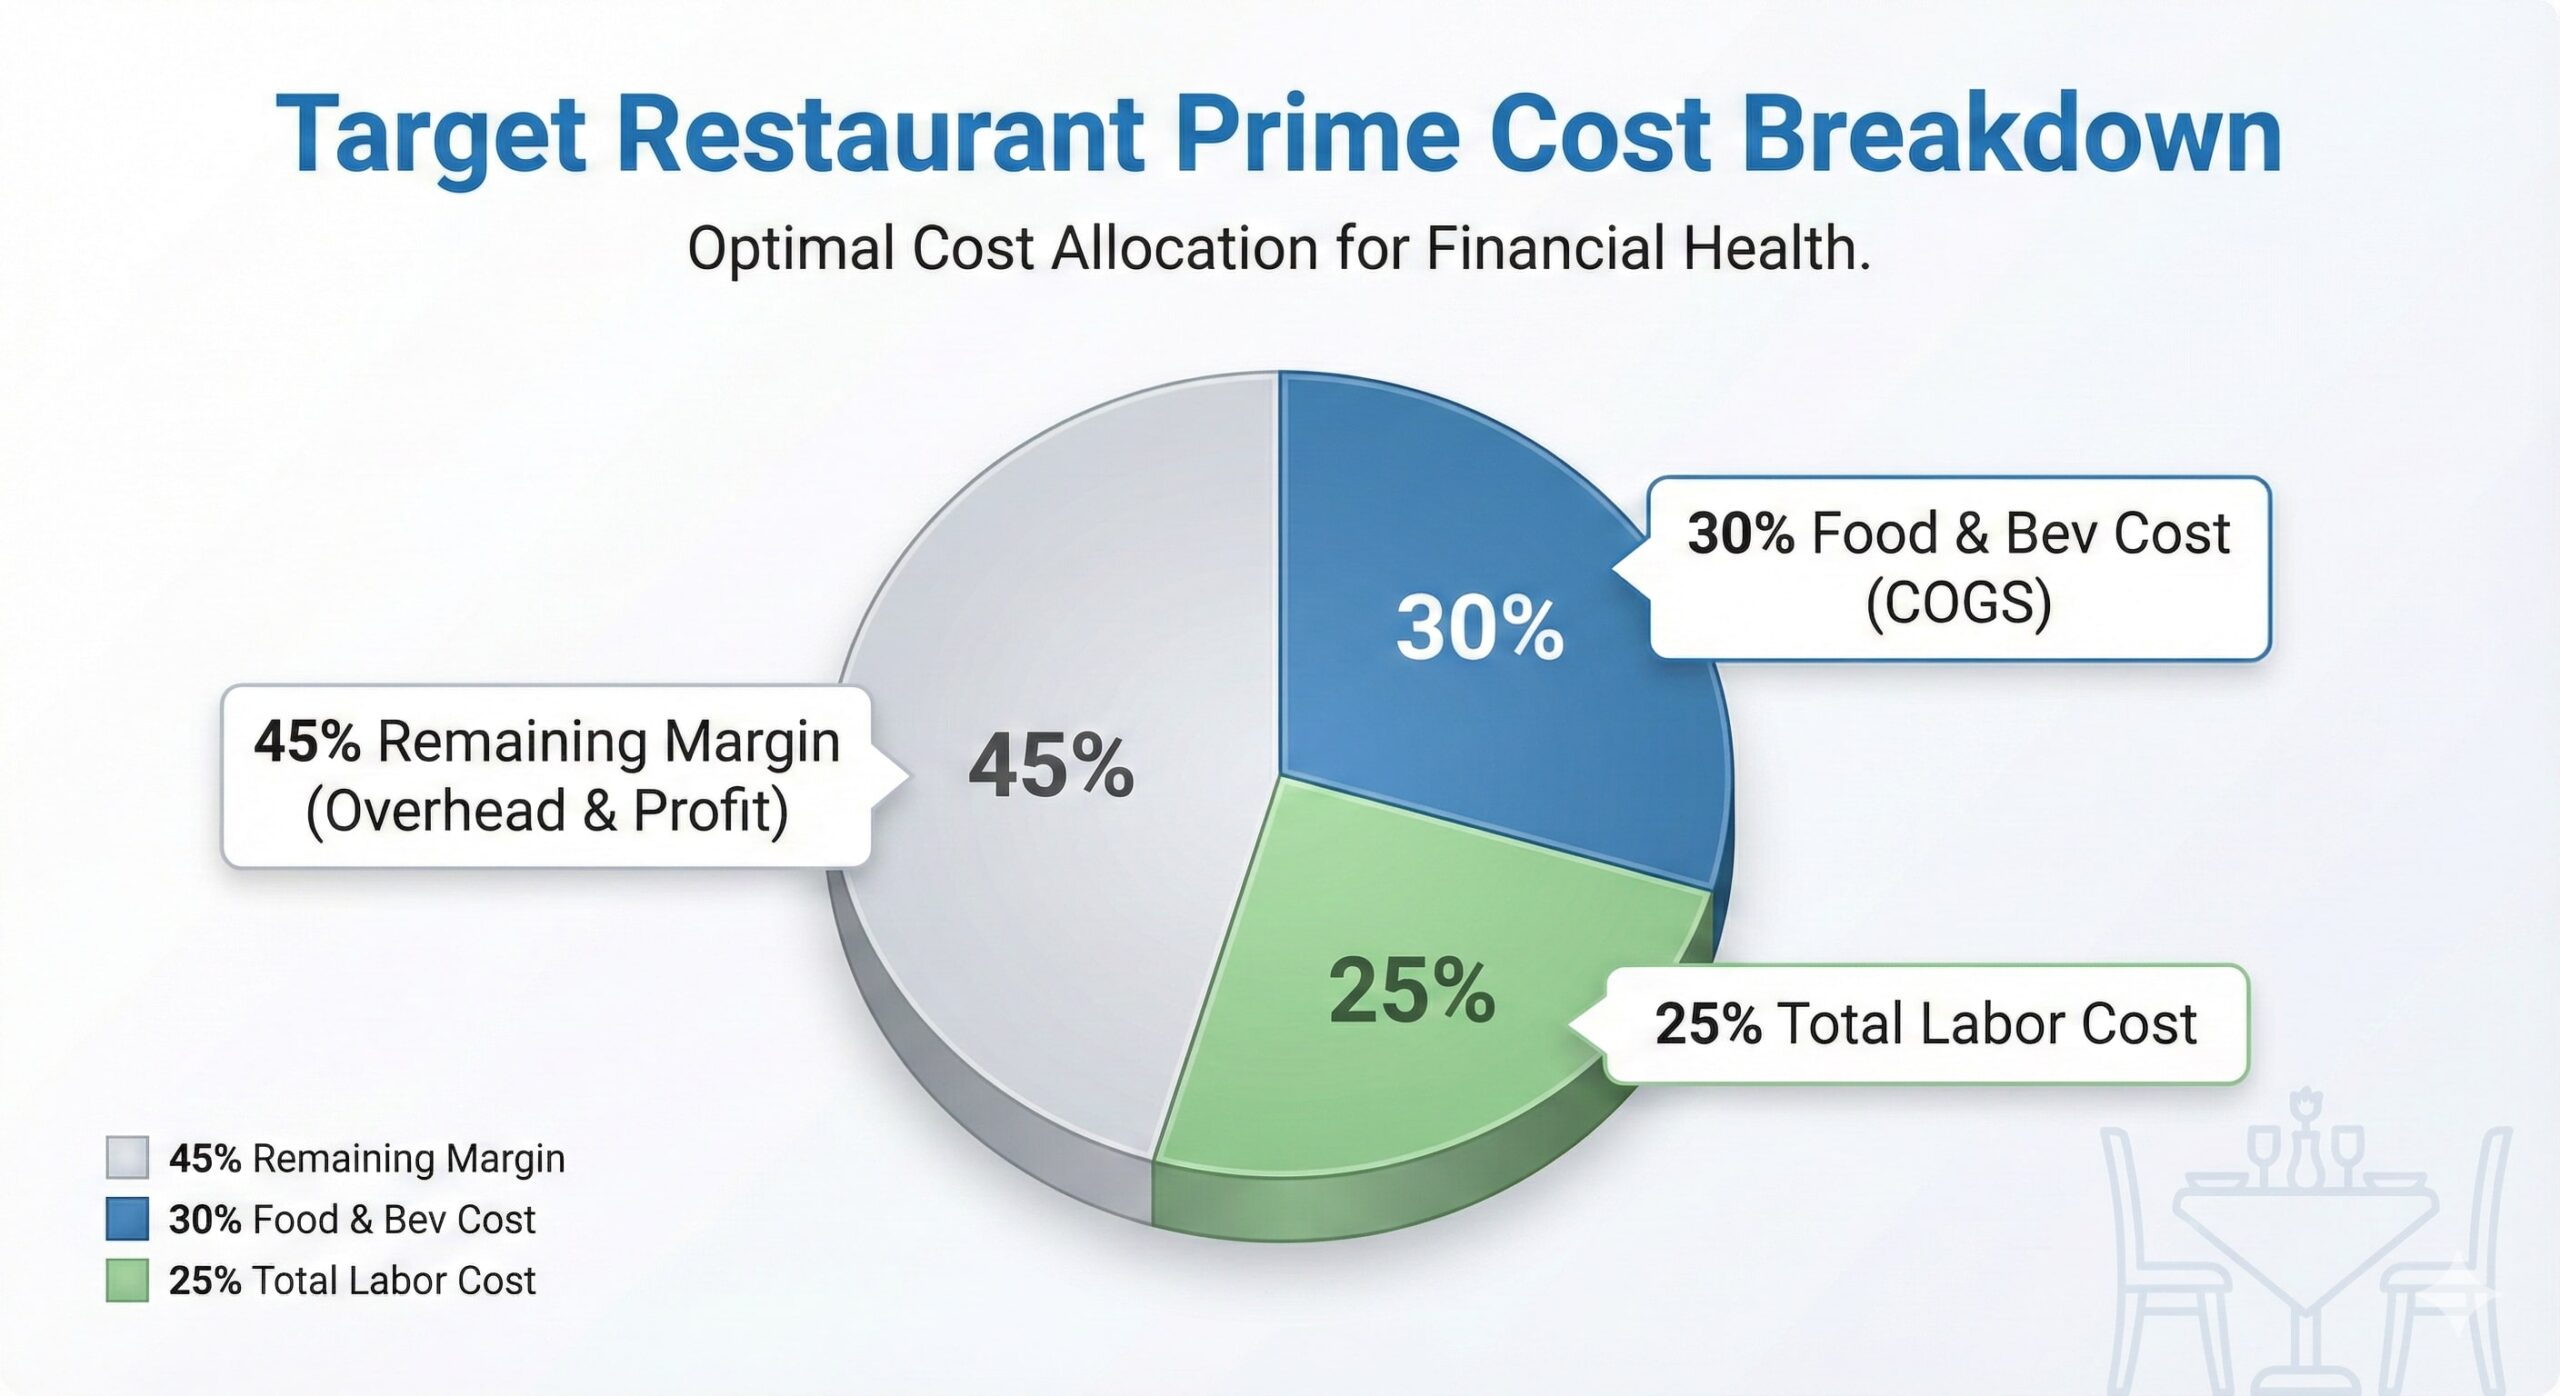
- The Target: Successful operators aim for a Prime Cost between 55% and 60% of total sales. If you are a QSR in Manhattan, aim closer to 55%.
- The Danger Zone: If your Prime Cost hits 65% or higher, you are likely operating at a loss.
- The Fix: Stop reviewing a monthly P&L that is 30 days old. You must track Prime Cost weekly. A deviation of just 3% here can wipe out 60% of your net profit.
2. The “Hidden Tax” of Inventory Variance
You bought the food from your local Manhattan suppliers, but did you sell it? Inventory Variance is the difference between the stock you should have (based on sales) and what you actually have sitting on the shelf.
- The Industry Norm: The average restaurant loses up to 20% of its inventory to waste, theft, over-portioning, or spoilage.
- The Fix: Implement a strict First-In, First-Out (FIFO) system. More importantly, conduct weekly physical counts of high-cost proteins and alcohol. If you aren’t measuring it, you’re losing it.
3. Letting “Dogs” Eat Your Profits (Menu Engineering)
Not all menu items are created equal. Using Menu Engineering, you can categorize dishes based on their popularity and profitability.
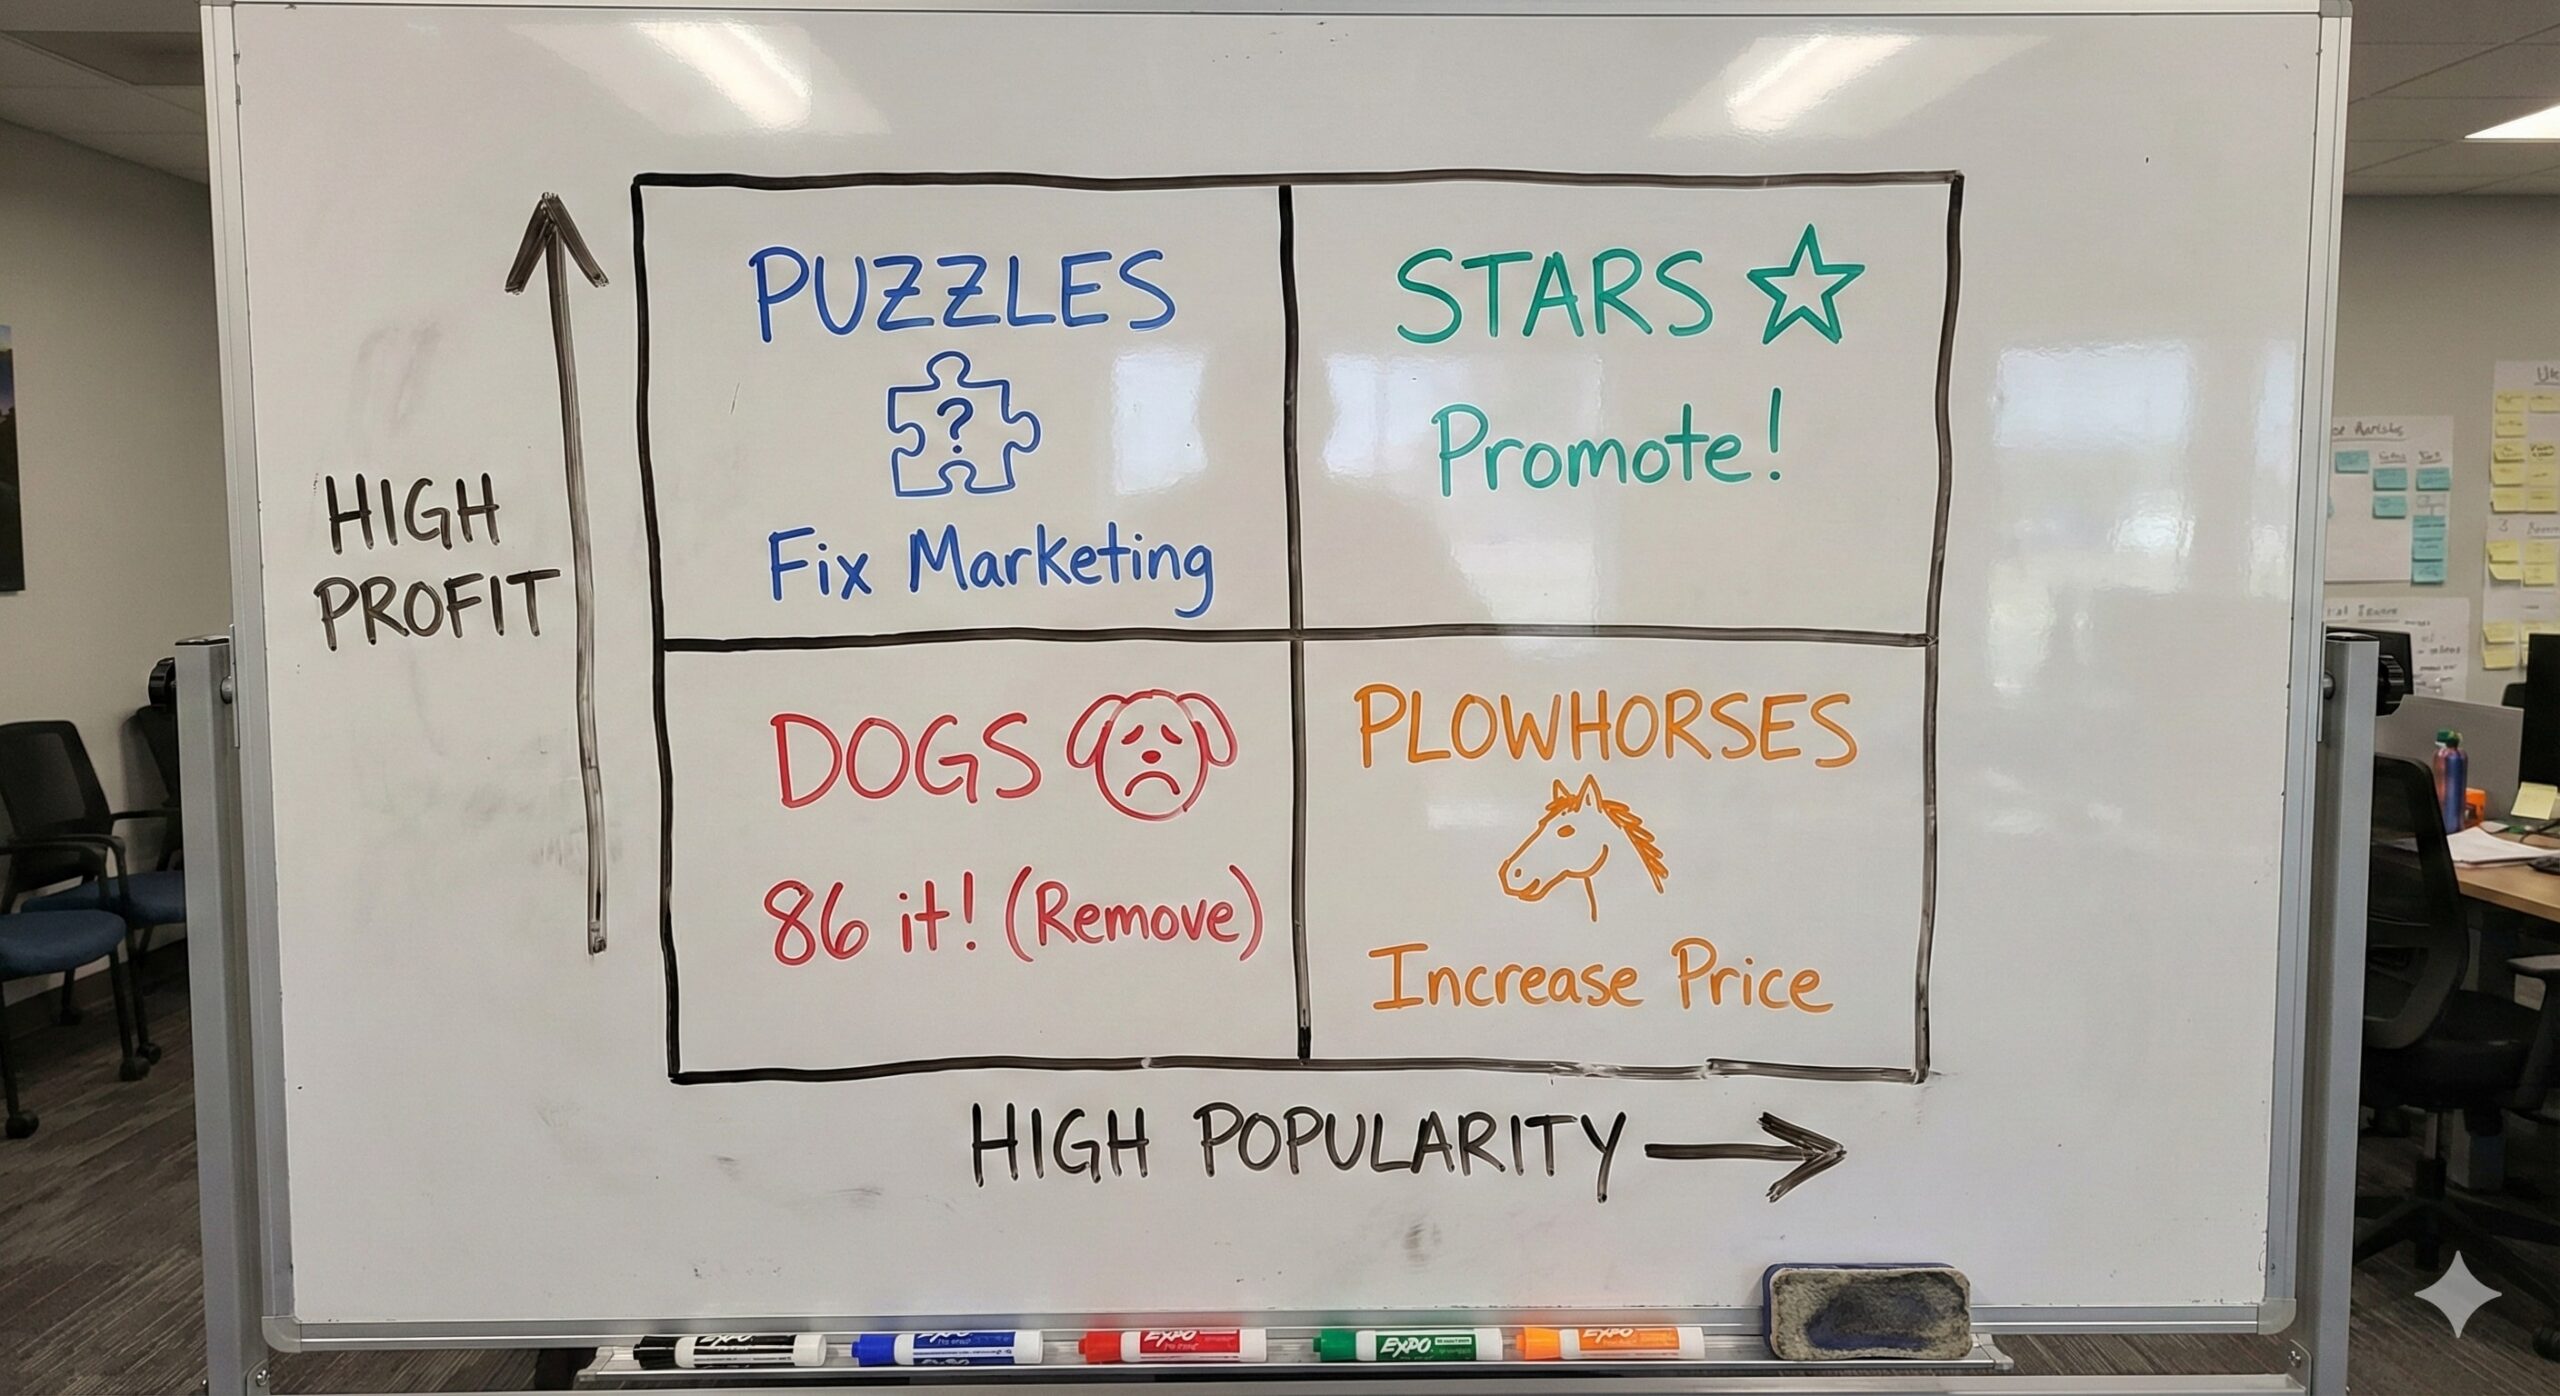
- Stars: High Profit, High Popularity. (These are your money makers—promote them on your NYC Google Business profile!)
- Plowhorses: Low Profit, High Popularity. (These drive traffic but kill margins. Consider raising the price slightly or decreasing portion size).
- Dogs: Low Profit, Low Popularity. (Get them off your menu immediately. They waste prep time and inventory space).
- Puzzles: High Profit, Low Popularity. (These need better marketing or a menu description rewrite).
4. Leaving Money on the Table (Average Order Value)
Acquiring a new customer in Manhattan is expensive. Increasing the spend of the customer already in your seat is pure profit.
- The Strategy: Train your staff to stop asking “Would you like dessert?” and start using specific, descriptive selling techniques.
- The Tactic: Use bundling and strategic placement. High-margin add-ons like beverages and appetizers can double the profitability of a check. Digital ordering systems can boost revenue by up to 30% simply by automatically suggesting add-ons.
5. Reactive Labor Scheduling
Labor is likely your highest or second-highest cost. If you are scheduling based on “how we’ve always done it” rather than sales forecasts, you are burning cash.
- The Benchmark: Your labor cost percentage should target 25–35%.
- The Fix: Use your POS data to forecast sales by the hour, not just the day. Make cuts early when it’s slow, and cross-train staff to handle multiple roles during lulls.
Stop Guessing. Start Governing Your Profits.
You didn’t open a restaurant in New York City to be an accountant, but staying in business requires thinking like one. If you are tired of high sales but low bank balances, it’s time to look under the hood.
We specialize in helping New York City restaurant owners analyze their P&L, optimize their Prime Costs, and re-engineer their menus for maximum profitability.
Ready to find your missing margins?
Let’s review your numbers and build a roadmap to 15%+ profitability for your NYC restaurant.